jQuery Chart & Graph plugins
Unlock the power of data visualization with our jQuery chart and graph plugins. Enhance your web projects with stunning, interactive visuals to effectively convey information and engage your audience.
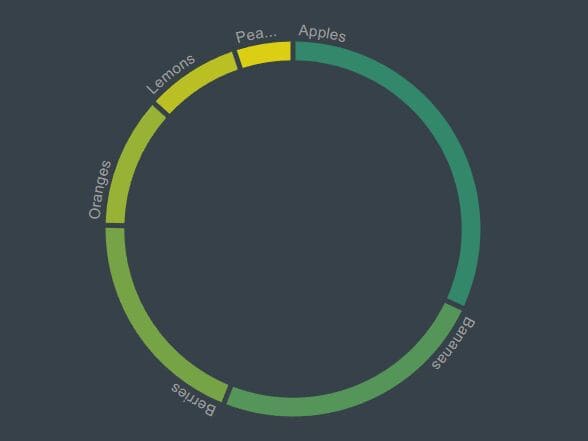
Animated Ring(Donut) Chart Plugin With jQuery And D3.js
We've all seen donut charts before. They're a great way to visualize data in a circular format.
Read more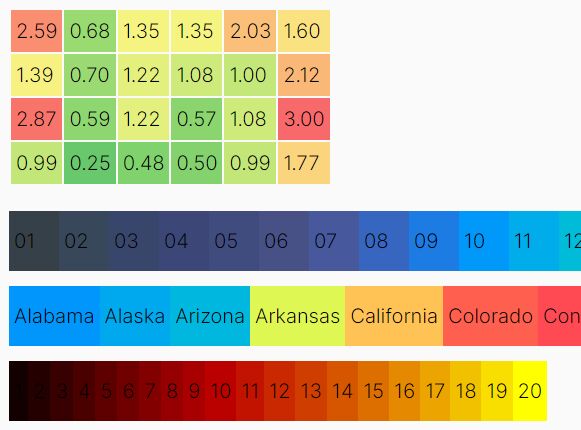
Create Heatmaps From Numerical Values In HTML Elements – jQuery Hottie
Hottie is a jQuery heatmap plugin for formatting HTML elements (like table cells and list items) with a range of...
Read moreStacked Bar Graph With jQuery and D3.js – StackBars
StackBars is a well-written, flexible plugin that facilitates the stacking of multiple bars to create a percent indicator graph.
Read more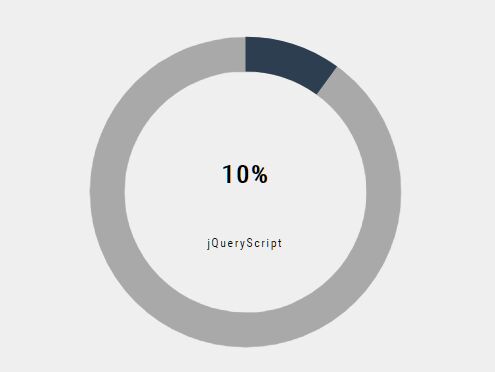
Minimal SVG Percentage Circle Plugin – PercentChart.js
A jQuery plugin to render an SVG based circular progress bar & loading bar that fills up with a given...
Read more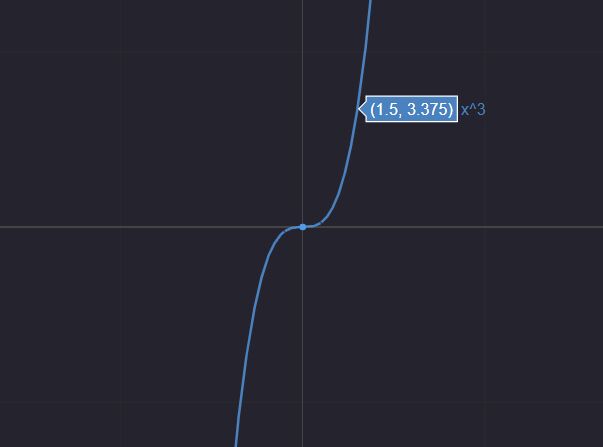
Fast Maths Function Plotter In JavaScript – Sidus
Sidus is a simple and fast function plotter that helps generate zoomable, pannable, downloadable graphs of mathematical functions you provide.
Read more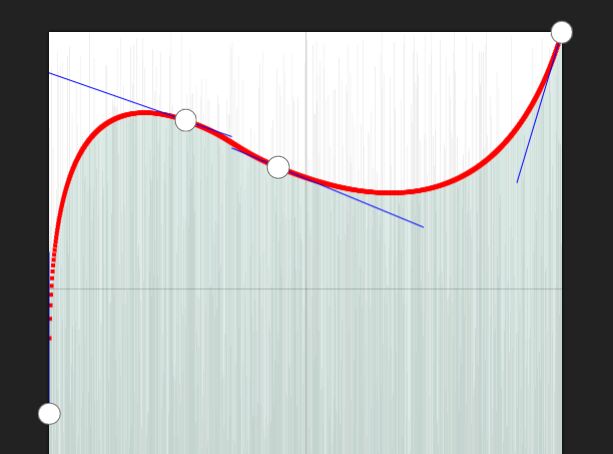
Create A Tone Curve UI Component In jQuery – iocurve
iocurve is a fully configurable jQuery plugin to create a Photoshop and Lightroom inspired Tone Curve UI where you can...
Read more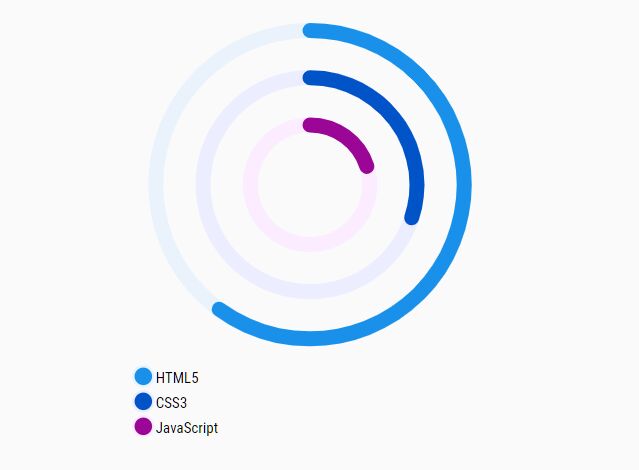
Create A Stacked Donut Chart With radialBar Plugin
radialBar is a tiny jQuery plugin for rendering multiple SVG-based concentric circles to visualize your percentage data as a stacked...
Read more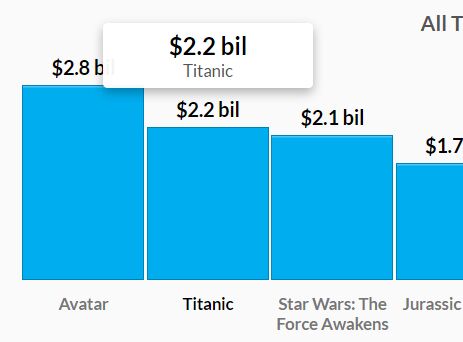
Tiny Animated Chart Plugin For jQuery – simple-chart
A simple, lightweight, dynamic, responsive, flexible, animated and cross-browser jQuery chart plugin that currently supports 5 chart types: progress, bar,...
Read more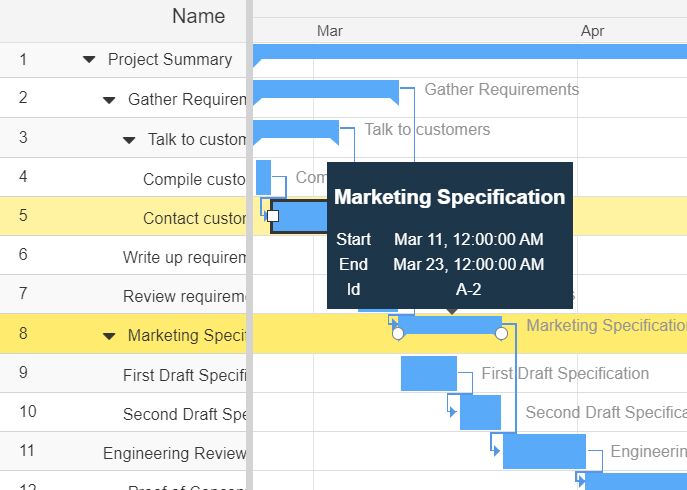
Fully Featured Gantt Chart Component By IBM
Gantt Chart is a type of bar chart that can be used to visualize your data (activities and scheduled tasks)...
Read more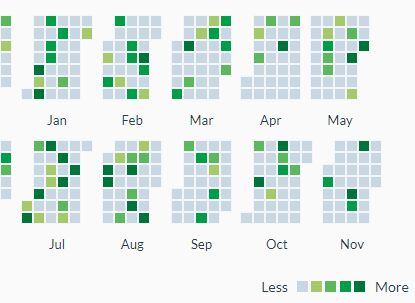
Calendar Heatmap Plugin With jQuery And Moment.js – CalendarHeatmap
CalendarHeatmap.js is a jQuery plugin used to generate a dynamic, interactive, configurable calendar heatmap for representing time series data.
Read moreFree jQuery Scripts: Elevate your web development with our diverse collection of complimentary jQuery scripts. Enhance interactivity, streamline animations, and enrich user experiences effortlessly.