| File Size: | 3.37 MB |
| Views Total: | 10026 |
| Last Update: | 09/16/2021 00:06:00 UTC |
| Publish Date: | 02/16/2020 03:12:48 UTC |
| Official Website: | Go to website |
| License: | MIT |
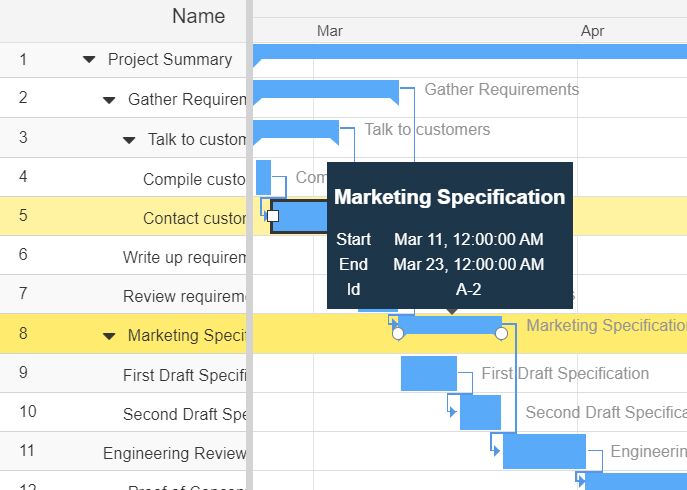
Gantt Chart is a type of bar chart that can be used to visualize your data (activities and scheduled tasks) in a 2D timeline interface.