| File Size: | 7.84 KB |
| Views Total: | 3381 |
| Last Update: | 03/01/2021 00:11:00 UTC |
| Publish Date: | 09/04/2020 02:53:22 UTC |
| Official Website: | Go to website |
| License: | MIT |
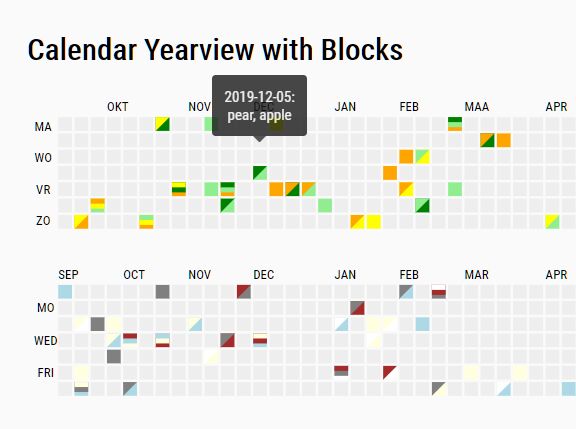
Just another jQuery plugin that dynamically renders a calendar heatmap (year view) to visualize time series data (like activities, contribution) similar to Github contribution graph.